Chamber quantification is a critical component of transthoracic echocardiography (TTE), including left ventricular (LV) end-diastolic and end-systolic volumes (EDV, ESV), end-systolic left atrial (LA) maximal volume and LV ejection fraction (LVEF). Indeed, the recently published guidelines 1 on chamber quantification recommend that two- or three-dimensional echocardiographic (2DE, 3DE) measurements of LV and LA volumes should be routinely performed as part of all clinical studies.

Today, real-time 3DE is a valuable tool for the assessment of LV and LA volumes and LVEF. Multiple studies have shown that 3DE is more accurate and reproducible than 2DE, because direct measurement of volumes can be achieved without the need for geometrical assumptions about cavity shape and limitations associated with foreshortened views.
Despite the well-known advantages of 3DE, this modality is not routinely used in clinical practice because of a variety of reasons, including (1) the need for 3DE-specific expertise and (2) the additional time needed for 3DE imaging. For 3DE to be routinely performed in clinical practice, it is necessary to have automated quantification implemented in order to avoid interruptions or delays in the workflow.
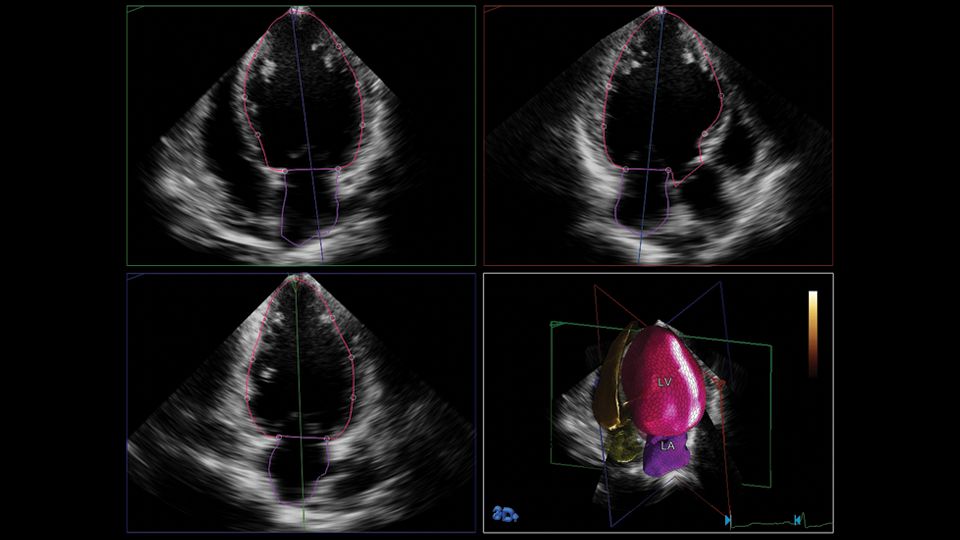
Philips has recently developed HeartModel, a fully automated 3D-TTE analysis software which simultaneously detects LA and LV endocardial surfaces throughout the cardiac cycle, using an adaptive analytics algorithm that consists of knowledge-based identification of initial global shape and orientation followed by patient specific adaptation (Figure 1). The process begins with the program estimating the LV end-diastolic (ED) frame using motion analysis near the peak of the electrocardiographic R-wave. Using this frame, general shape orientation is identified, and then the LV end-systolic (ES) frame is estimated using motion analysis to identify the smallest LV cavity. Once LV ED and ES frames have been estimated, preliminary ES and ED models of the LV and LA are built using the automatically detected endocardial surface in conjunction with information from a 3D TTE LA and LV database. This database consists of a variety of LA and LV ED and ES shapes obtained from approximately 1,000 3D-TTE data of varying image quality in patients with a wide range of chamber size and function. The program matches features from the LV volume being analyzed to selected shapes in the database. This selected shape is then locally adapted to the LV volume under study using a series of incremental steps. The ED and ES frames are then finally detected by evaluating the LV volumes in the neighborhood of end-diastole and end-systole and selecting the frame with the maximum and minimum volumes, respectively. The algorithm was designed to adjust to a variety of imaging conditions, including variations in dropout, acoustic clutter, ventricular shape and cardiac orientation relative to the transducer. However, similar to manual measurements, a minimum number of visible endocardial border segments (~14-15 of 17 LV segments) is necessary for an accurate estimate of the chamber volume to be derived. Lastly, when run on the same data set, the algorithm has a deterministic convergence response, thus yielding zero variability. Once the final model has been fitted, the LA and LV contours are displayed on 2D cut-planes derived from the 3DE data sets showing the ES and ED 4-, 3- and 2-chamber views (Figure 2). If the user is not satisfied with the LA and LV contours, they could be manually edited.

Figure 1

Figure 2
This new fully automated software has been recently validated and found to be reasonably accurate compared to manual 3D measurements using QLAB (3DQ)2 in a group of over 150 patients at the University of Chicago. This promising software has the potential to enable the integration of 3DE volumetric LV and LA measurements into routine clinical workflows around the globe.
In this study, we sought to determine the time saving potential of this novel software when compared to conventional 2DE and 3DE methods used to measure LV and LA volumes.
2DE and 3DE imaging was performed in 30 consecutive patients using an EPIQ system with an X5-1 matrix array transducer (Philips, Andover, MA). The time required for the acquisition of the 2DE LV apical 4-chamber (A4C) and 2-chamber (A2C) views, LA A4C and A2C views and a 3DE full volume data set of the LV and LA were recorded. In addition, the time required for the LV (end-diastolic and end-systolic) and LA (end-systole) volume measurement using the biplane method of disks from the 2DE images was recorded. Finally, the time required to complete the data analysis to obtain LV and LA volumes from 3DE data sets using QLAB and with the new HeartModel software were recorded. The HeartModel analysis was performed both on a standard personal computer and in the EPIQ imaging system with and without global and regional adjustments.

Table 1
Table 1 shows the data for the time required for data acquisition and analysis. Overall, 3DE image acquisition required less time than the multiple 2DE views that are needed for the volume measurements. Furthermore, analysis of the 3DE images was significantly faster than that of the 2DE images, and analysis time was further shortened with the use of the automated HeartModel software (Figure 3). Of note, total time saved for acquisition and analysis combined was 82% in the fully automated mode and 63% even when manual editing was performed.
To fully understand the time that HeartModel can save per day in a busy echocardiography laboratory performing 50 TTE studies daily, we multiplied the combined acquisition and analysis time by 50 (Figure 4). This representative example shows that acquisition and analysis of LV and LA volumes using 2DE takes almost 3 hours a day, while it would take only 66 minutes using HeartModel with minor editing and just over half an hour using the fully automated mode, thus saving a typical echocardiography laboratory 2.5 hours every day.

Figure 3

Figure 4
A representative example shows acquisition and analysis of LV and LA volumes using 2DE takes almost three hours a day, while it would take only 66 minutes using HeartModel with minor editing and just over half an hour using the fully automated mode.
3DE has been shown by multiple investigators to be more accurate and reproducible than 2DE. To allow the 3DE technology to be used routinely in clinical laboratories there is a need to implement automated methods that overcome the time-consuming workflow dictated by 3DE today. The new fully automated HeartModel software has been recently validated and found to be accurate and reproducible compared to manual 3D measurements using QLAB (3DQ). 2 In this study, we found that this new fully automated tool is significantly faster than both 2DE and manual 3DE (QLAB) analysis and thus can help overcome the time-consuming nature of the 3DE analysis that currently limits its use and facilitate its incorporation into the clinical workflow.

Automated transthoracic 3D Echo quantification of left heart chambers